Kayode Osinusi
Verified Expert in Design
Kayode is a seasoned UX designer with a passion for developing thoughtful visual content and delightful user experiences.
As designers, we want the products we build to be satisfying and easy to use, but how can we know that’s the case? We start by measuring the user experience with evidence rather than opinions.
As designers, we want the products we build to be satisfying and easy to use, but how can we know that’s the case? We start by measuring the user experience with evidence rather than opinions.
Kayode is a seasoned UX designer with a passion for developing thoughtful visual content and delightful user experiences.
As designers, we want the products we build to be satisfying and easy to use, but how can we know that’s the case? We start by measuring the user experience with evidence rather than opinions. But can UX really be measured? Absolutely. By evaluating products with qualitative and quantitative methods, we gain access to a host of illuminating user experience metrics.
There’s nothing like completing a UX project. It takes an incredible amount of time, effort, and skill to travel from design problem to solution. Crossing the finish line is a great feeling, but seasoned UX designers know that there’s always more to be done…
A C-level executive calls with a question. “Now that the project is over, how do we track the results we’re trying to achieve?”
It’s a fair concern—one that leads to a bigger topic. How can UX designers measure success and prove that their work is worth the investment? Understanding project and business goals is a good start, but there’s more to user experience measurement.
To determine the success of a UX project, we need to know how and why people use products and evaluate the outcomes with UX success metrics.

What do we mean when we say that a product is usable?
According to the International Organization for Standardization, usability is “the extent to which a product can be used by specified users to achieve specific goals with effectiveness, efficiency, and satisfaction in a specified context of use.”
There’s a lot going on there. Let’s pull out the important parts.
If we were to oversimplify, we might say that usability is “the extent to which a product helps users achieve goals in a specific use case.” But we’d be making a major omission.
When products aren’t satisfying or they make it hard to accomplish goals, users look elsewhere. The only way we can know if we’re really solving design problems (and not causing them) is to test the usability of the products we create.
We use metrics for measuring UX success so that we can refine products and impact users for good.

Before collecting data, it’s a good idea to outline a strategy for how to measure the user experience.
Task success rate is one of the most widely used and easily understood UX metrics. It shows the percentage of participants that successfully complete a task and helps designers identify user experience issues. As long as tasks have clearly defined goals, success rates can be measured.
Tasks like completing a signup process or adding a specific item to a shopping cart are well-suited for this metric. Keep in mind, success rate doesn’t explain how well users perform tasks or why they fail them.

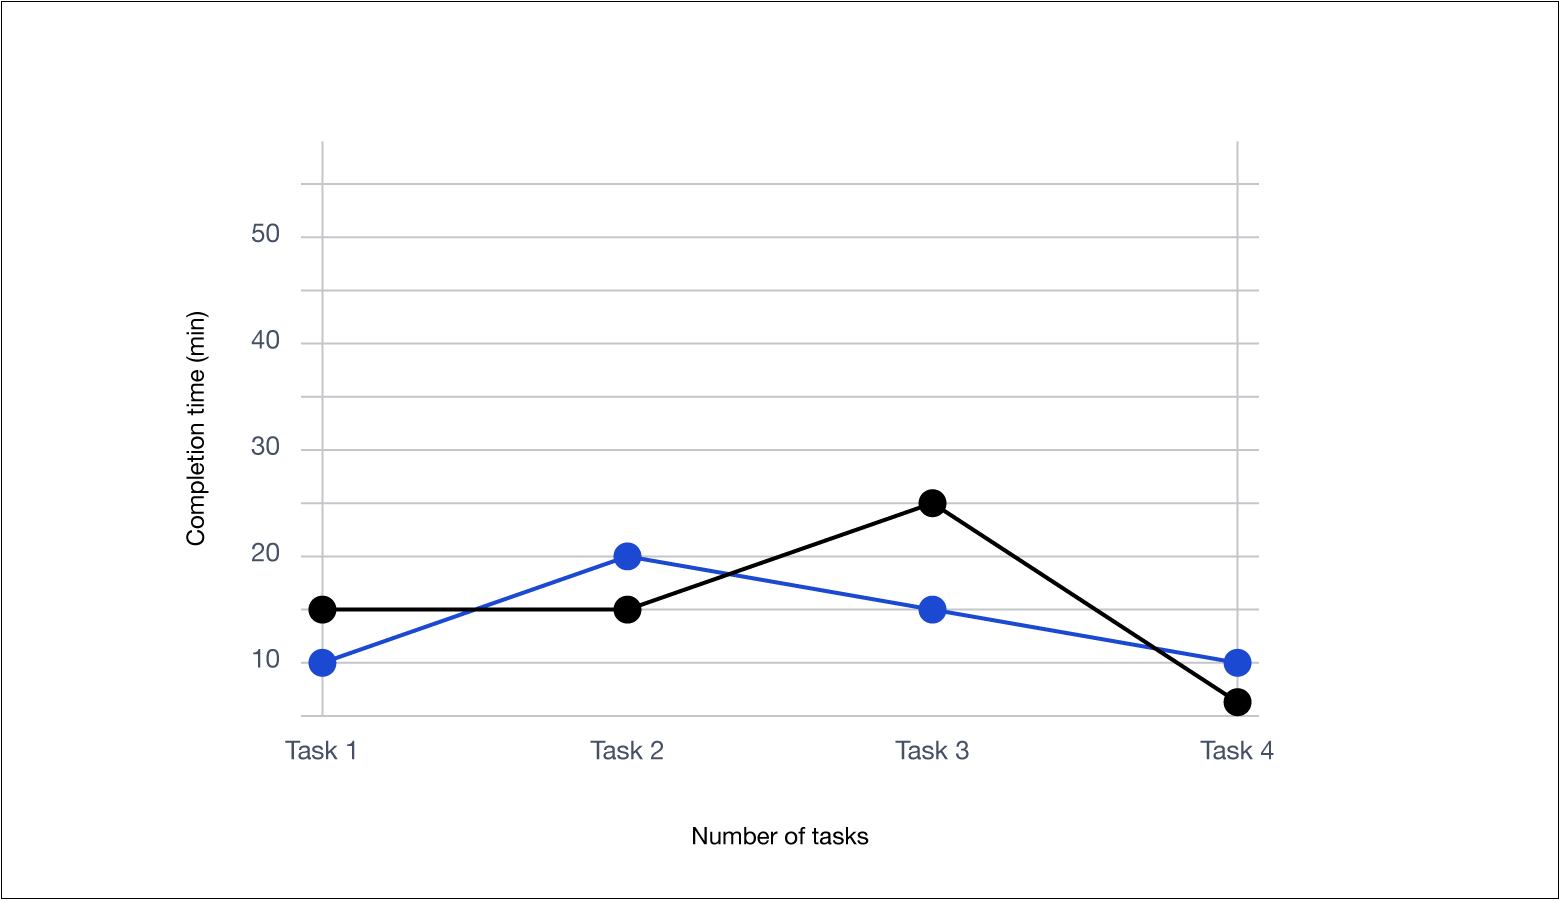
This metric measures the amount of time it takes a user to complete a task. Due to varying factors, different users will have different completion times for the same task. In general, the less time a user spends on a task, the better the UX.
Depending on the evaluation method and type of project, there are multiple ways to determine task completion time.
Broadly speaking, retention rate is the percentage of users that continue to use a product over time. But to measure the retention rate of a product accurately, there must be a clear definition of what actions and activity levels constitute use.
Actions may include logging in, visiting a web page, downloading/uploading files, using a key product feature, etc. Measuring retention is an excellent way to understand the long-term usefulness of a product.
Conversion rate measures the percentage of users who perform a desired action. Desired actions link to product goals and cover everything from completing a registration process to making a purchase.
It’s important to note that percentages can be misleading. For example, a website may experience a spike in traffic due to a marketing campaign. Even if sales increase, the site’s conversion rate could plunge because of the increased traffic.
Error rate identifies the percentage of bad entries made by users. It’s calculated by dividing the number of errors by the number of attempts made. High error rates indicate usability problems. As with other UX metrics, it’s crucial to define what erroneous actions are.
Customer satisfaction measures users’ overall fulfillment levels, and it can be tracked in various ways.

Heuristics are predefined usability principles (empirical rules of thumb, standards, and conventions) that have been observed and tested over an extended period of time.
In a heuristic analysis, expert evaluators identify the usability issues of digital products and rate their severity, thereby allowing UX designers to quickly learn about and address shortcomings.

Several UX measurement frameworks can help designers better understand and improve the user experience.
Created in 2007, the AARRR framework is focused on company growth. It monitors a customer’s life cycle with a company and allows designers to track Acquisition, Activation, Retention, Referral, and Revenue (AARRR).
The RARRA framework is virtually identical to AARRR, but due to fierce competition among digital products, it prioritizes Retention over Acquisition. The thinking is that if an app fails to make a good first impression, users may never come back.
The CX Index was introduced by Forrester in 2016 as a way to monitor brand touchpoints, measure customer loyalty, and learn how each affects revenue. The framework has two key indicators:
As a company’s CX Index score increases, so does its ability to win and retain customers.

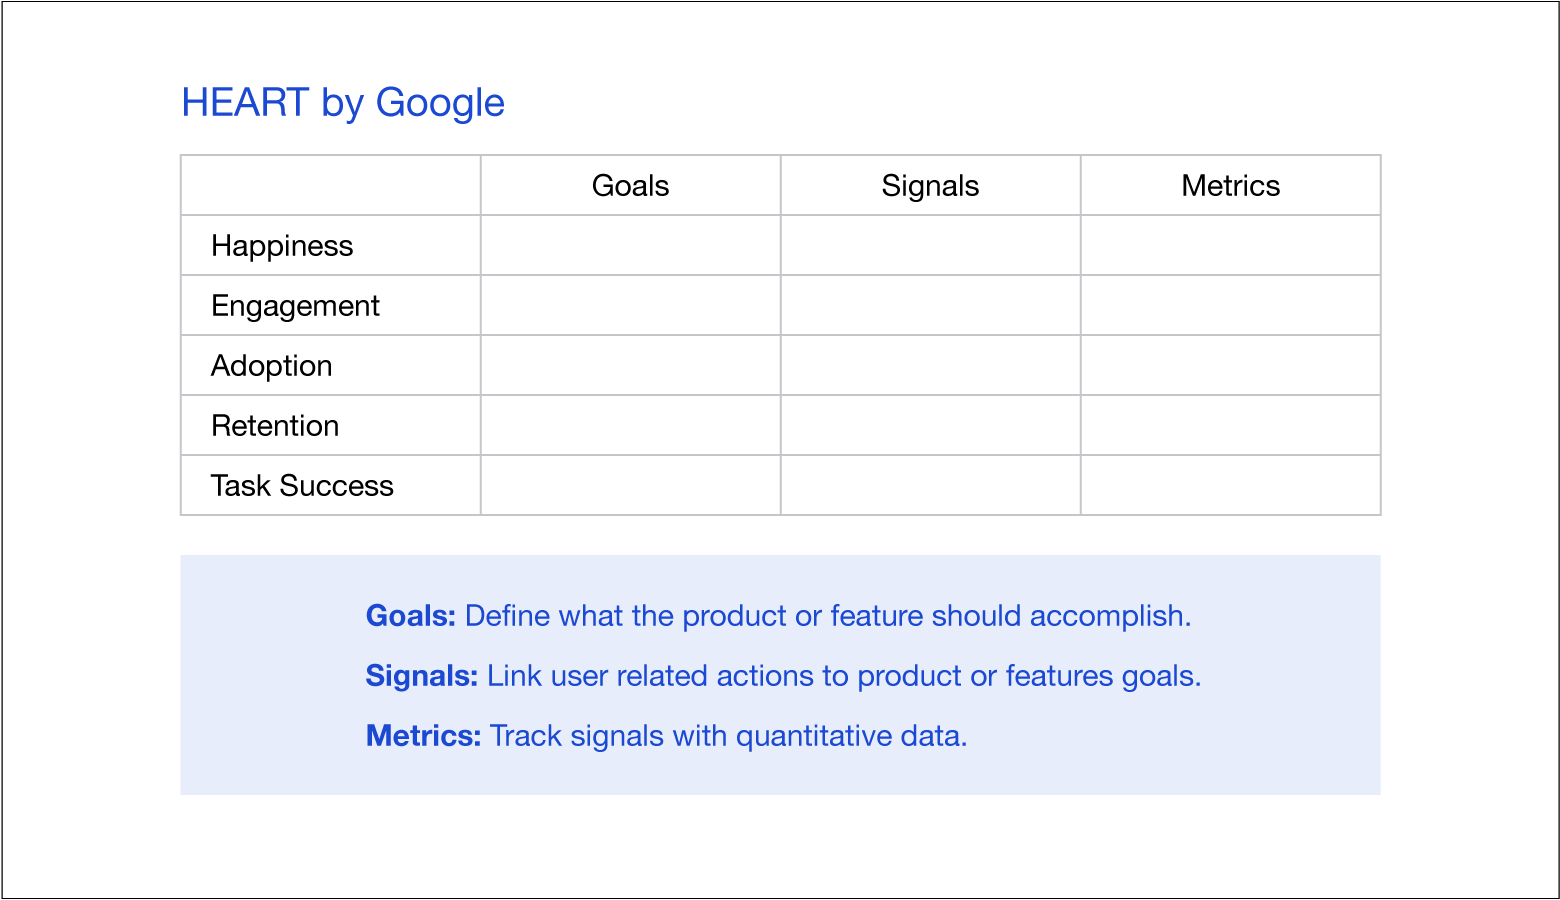
In 2010, the Google Research Team developed a framework to measure the success of products and features. The framework’s user-focused metrics form an easy-to-remember acronym.
UX metrics provide data that allows designers to measure and compare the usability of digital products over time. They reveal areas of products that need to be improved and help designers evaluate decisions based on evidence rather than opinions.
Like all tools, metrics and frameworks should be used in the right context. UX designers must strategically link metrics to client objectives and user needs.
For designers looking to build products that are both easy and satisfying to use, knowing how to measure user experience makes all the difference.
Let us know what you think! Please leave your thoughts, comments, and feedback below.
Choosing UX metrics for a product comes down to understanding business goals and the product’s user experience KPIs. For instance, measuring task completion time makes sense for an activity like registration but would be useless when applied to browsing an image gallery.
Measuring the user experience is all about defining targets. For example, an eCommerce company sets a goal for a product page to turn 20% of visitors into paying customers. To track the page’s success, the company would measure conversion rate. In this case, 1 out of 5 users would need to make a purchase.
Measuring UX success requires tracking a mix of quantitative and qualitative metrics. Quantitative metrics are numbers based and help establish performance trends. Qualitative metrics are feelings based and shed light on users’ inner motivations and perceptions.
UX success metrics shed light on the effectiveness of features within digital products. There are many metrics that may be used to track company-defined goals. For example, retention rate measures the percentage of users that continue to use a product over time. The longer that users stay engaged, the better.
Kayode is a seasoned UX designer with a passion for developing thoughtful visual content and delightful user experiences.
 authors are vetted experts in their fields and write on topics in which they have demonstrated experience. All of our content is peer reviewed and validated by Toptal experts in the same field.
World-class articles, delivered weekly.
World-class articles, delivered weekly.
Join the Toptal® community.